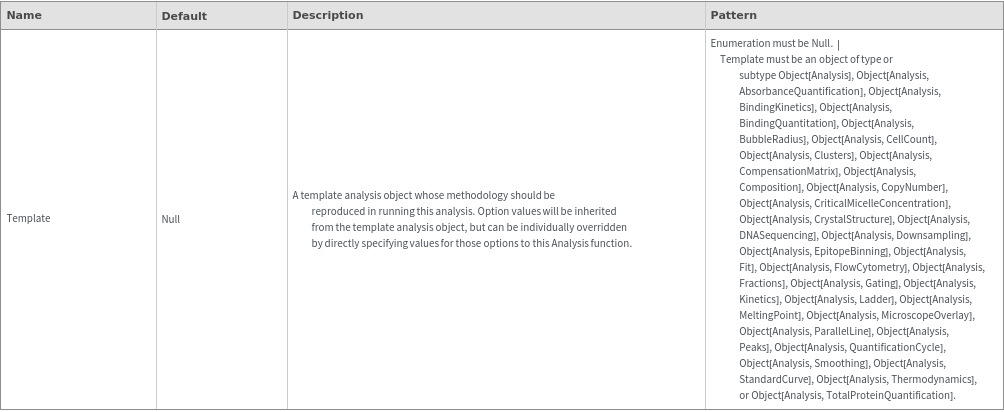
AnalyzeFlowCytometry
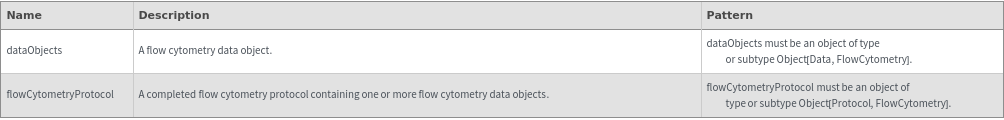
AnalyzeFlowCytometry[dataObjects]⟹analysisObject
uses clustering analysis to partition the flow cytometry data in dataObjects into clusters of cells, and records the partitioning and cell counts in analysisObject.
AnalyzeFlowCytometry[flowCytometryProtocol]⟹analysisObjects
uses clustering analysis to partition and count the cells in each flow cytometry data object generated by flowCytometryProtocol, and stores the results in analysisObjects.
Details
- AnalyzeFlowCytometry uses AnalyzeClusters to partition datapoints into different clusters for labeling and counting.
- Set Method to Automatic to use automatic clustering, or Manual to label clusters using manually drawn gates.
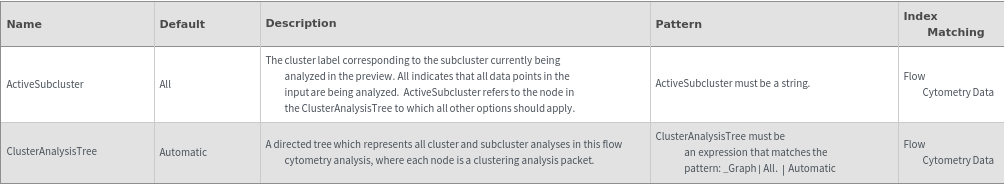
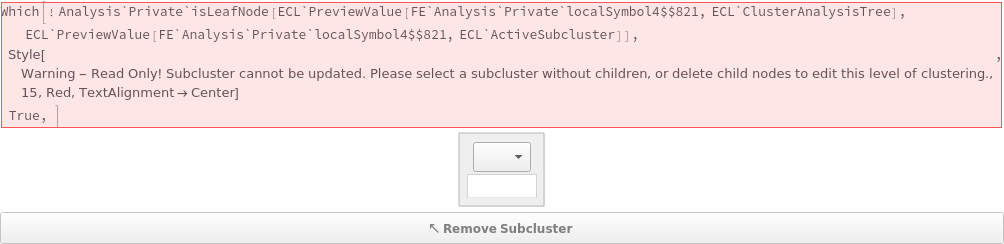
- Clustering methods may be mixed-and-matched using subcluster analysis in the AnalyzeFlowCytometry preview app, which utilizes the ClusterAnalysisTree and ActiveSubcluster options to select data to analyze.
- See the documentation page for AnalyzeClusters for additional examples.
Input
Output

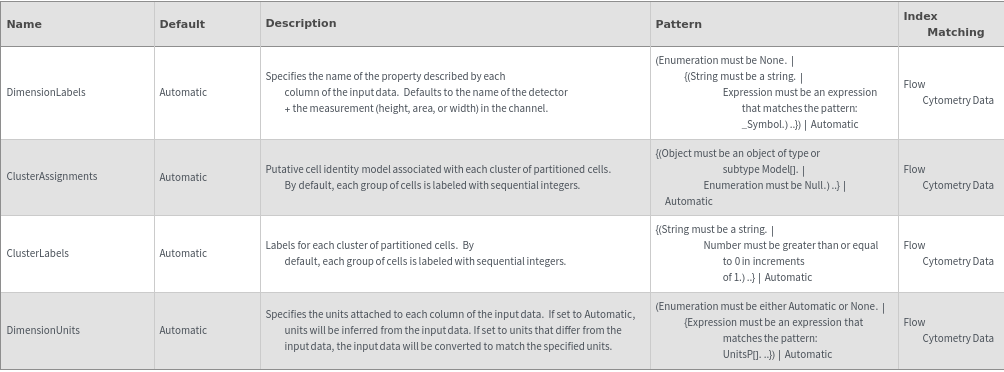
Data Annotation Options
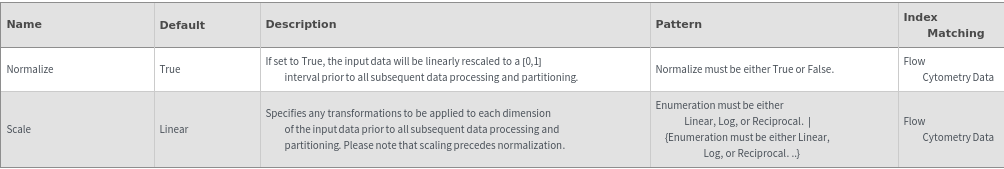
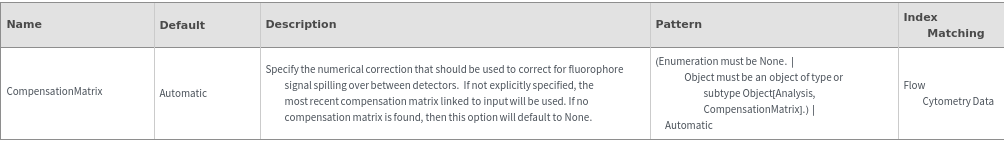
Data Preprocessing Options
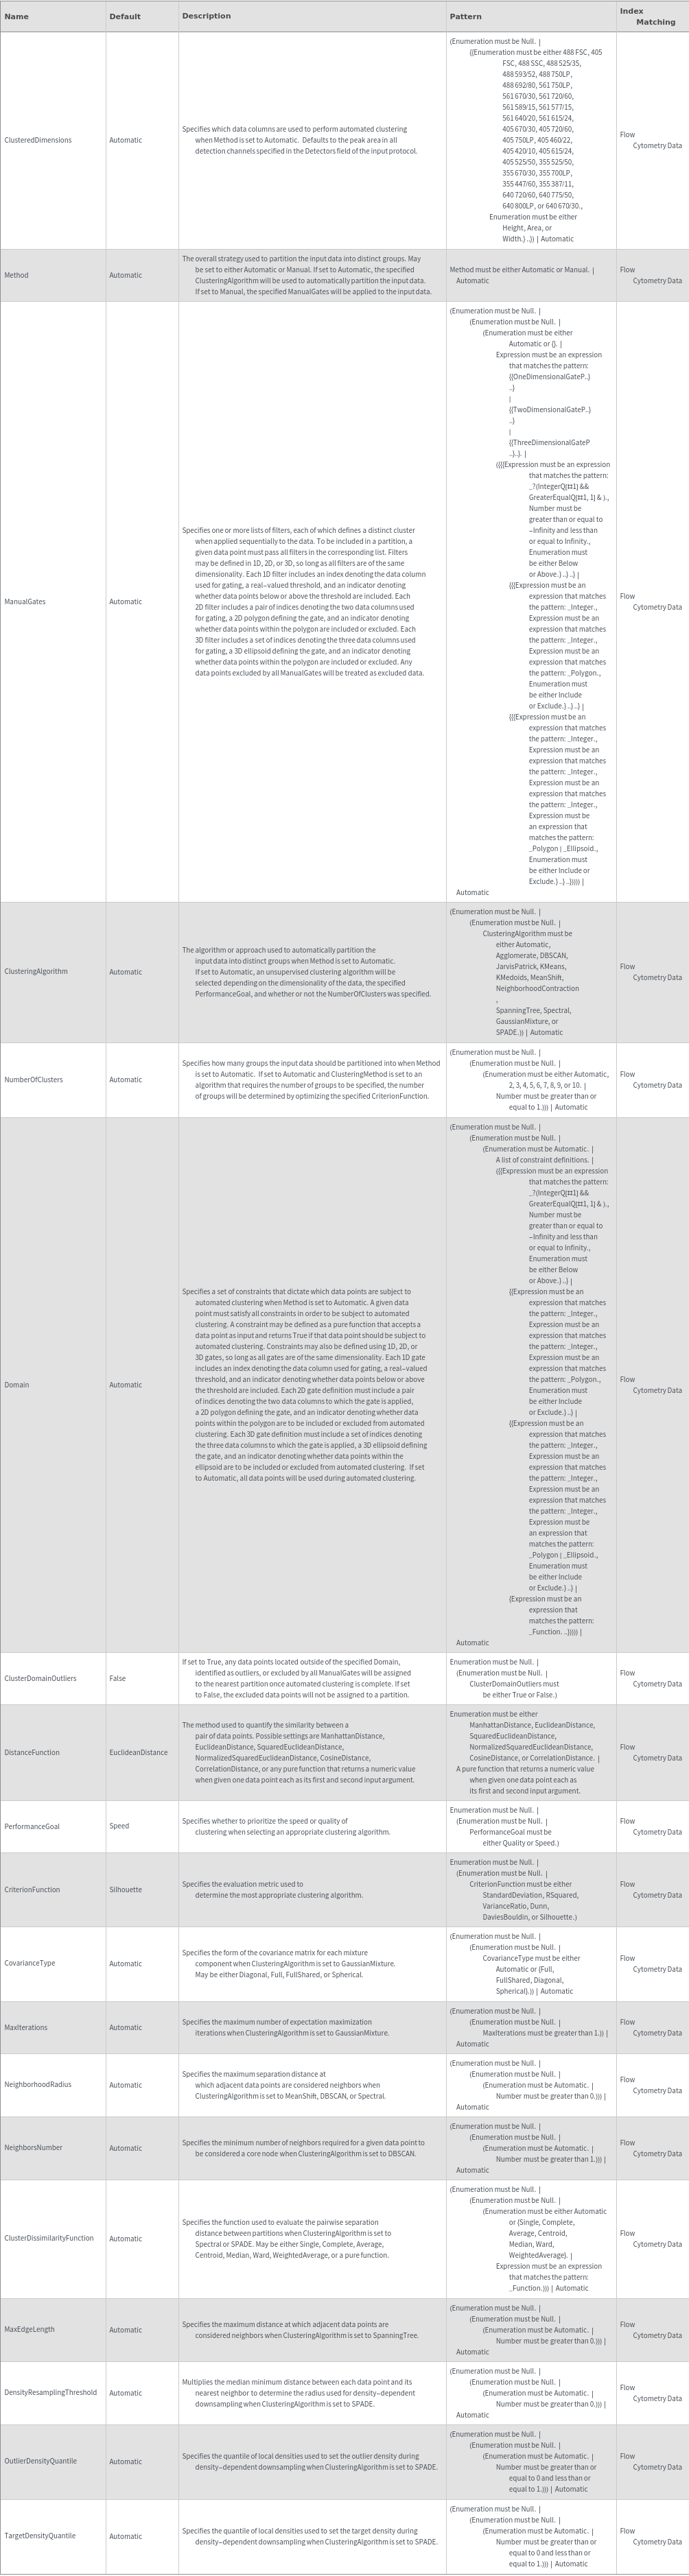
Data Processing Options
Methodology Options
Organizational Information Options

Subclusters Options
Method Options
Examples
Basic Examples (2)


Additional Examples (3)
Interactive Preview App (3)
Set Method->Manual and click on the 1D and 2D projection tabs to perform interactive clustering with thresholds and polygonal gates:


Set the clustering method, algorithm, and other options from the option selector. The interactive app will show automatically identified clusters. By default, AnalyzeFlowCytometry will cluster using peak areas from all detectors for which data is available:

Use the interactive AnalyzeFlowCytometry preview app to set options for the analysis. To access all interactive features, please load AnalyzeFlowCytometry in the command builder. By default, the projection selector is shown first - Press the [Update Grid] button to generate a multi-dimensional display of flow cytometry data. The default dimensions in the projection selector are automatically chosen to maximize cluster variance: