PlotBetaTestingSupportRate
PlotBetaTestingSupportRate[function]⟹plot
creates a plot indicating the support ticket rate per protocol as a function of number of protocols since the start date.
Details
Input

Output

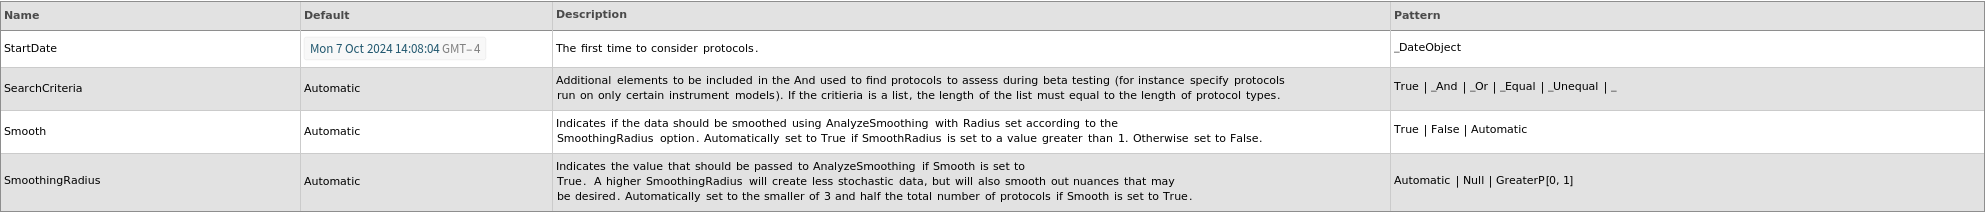
General Options
Examples
open allclose allBasic Examples (1)
Last modified on Tue 7 Oct 2025 18:20:40